RSKIA: Unveiling Value in a Cash-Rich, Underfollowed Small-Cap
Comprehensive Analysis & Recommendation Report: George Risk Industries, Inc. (RSKIA)
Ticker: RSKIA | Exchange: OTC (PNK) | Sector: Industrials
Prepared by: Moods Investment Research
Company Overview
George Risk Industries, Inc. (RSKIA) designs, manufactures, and sells various electronic components worldwide. Its product range includes computer keyboards, proximity switches, security alarm components and systems, pool access alarms, EZ Duct wire covers, water sensors, electronic switching devices, security switches, and wire and cable installation tools. Additionally, the company provides door and window contact switches, environmental products, liquid detection sensors, and raceway wire covers.
These products cater to residential, commercial, industrial, and government installations. The company’s primary customers include security alarm distributors, alarm installers, original equipment manufacturers, and distributors of off-the-shelf keyboards. George Risk Industries, Inc. was founded in 1965 and is headquartered in Kimball, Nebraska.
Financial Performance Analysis
Historical Financial Performance (2014–2024 TTM)
· Revenue CAGR (2014-2024): 7.3%
· Net Income CAGR (2014-2024): 12.5%
2024TTM
· Gross Margin: 49.6%
· Operating Margin: 28.6%
· Return on Invested Capital (ROIC): 8.2% (current). 10-Year Average ROIC:10.11%
· Dividend Yield: 5.8%
· Free Cash Flow (FCF) Yield: 7.8%
. Earnings Yield: 12.13%
. Net Current Asset Value (NCAV): $51.5M vs. $83.7M Market Cap. Most of its NCAV consists of liquid working capital, which may limit downside risk, assuming asset quality is strong
Abnormally High Profits in 2021
Contributing Factors (Year Ended April 30, 2021)
· PPP Loan Forgiveness: $950,000*
· Deferred Income Taxes: $1,988,000
· Unrealized Gain (Loss) on Equity Securities: $7,007,000
*Paycheck Protection Program Loan (PPP)
On April 15, 2020, the company secured a $950,000 loan (“PPP Loan”) from FirsTier Bank under the Paycheck Protection Program, which was established under the CARES Act on March 27, 2020. The PPP Loan, documented in a Note issued on April 15, 2020, carried an interest rate of 1% per annum and was set to mature on April 15, 2022. The loan proceeds were allocated to qualifying expenses. On December 3, 2020, the company received official notice of full loan forgiveness from the lender. Subsequently, in January 2021, it was determined that the forgiven amount was not taxable. The loan forgiveness is recorded under the “Other Income” section of the income statement.
Key Financial Strengths
· Strong Liquidity: The company holds $5.45 million in cash and $36.36 million in investments.
· No Significant Debt: Reflecting low financial risk.
· Consistent Profitability:
Q2 2024 Net Income: $2.215 million (compared to a $55,000 loss in Q2 2023).
Six-Month Net Income (2024): $4.92 million, up from $2.319 million in 2023.
· Increased Dividend Payments: The dividend was raised to $1.00 per share, up from $0.65 per share last year.
Preferred Stock
Each share of Series #1 preferred stock is convertible at the holder's option into five shares of Class A common stock. Additionally, it is redeemable at the discretion of the board of directors at a rate of $20 per share. Holders of the convertible preferred stock are entitled to an annual dividend of up to $1 per share, payable quarterly as declared by the board.
Hidden Value: Cash, Investments & Property (2024 TTM)
· Cash & Short-Term Investments: $41.6M (68.4% of total assets).
· Property, Plant & Equipment (PP&E) + Land: $2.0M (3.3% of total assets).
· Net Debt Position: -$7.1M (No debt. These are simply payables, including accrued expenses, dividends, and deferred taxes. Since there is no actual debt, cash exceeds total liabilities.
· Investments: Equity and municipal bonds with unrealized gains of $10.9M.
Analysis of RSKIA's Investments & Income Contribution (2024)
1. Investment Portfolio Composition & Valuation
As of October 31, 2024, RSKIA holds $36.36M in investments at fair value, broken down as follows:
Key Observations:
Equity Securities Dominate: 77% of the portfolio (27.98M), with 10.7M in unrealized gains**.
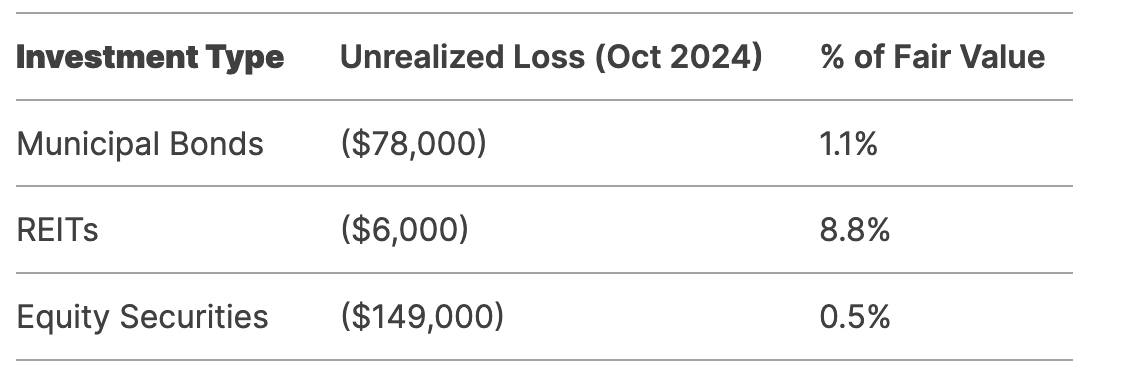
Municipal Bonds: Stable but impacted by interest rate hikes ($78K unrealized loss).
Liquidity: $892K in cash equivalents.
Income Reliance: 50% of net income is market-dependent (risky but high-reward)
2. Income Contribution: Operations vs. Investments
For the six months ending October 31, 2024:
Breakdown of Investment Income:
Dividends & Interest: $616,000 (20% of investment income).
Unrealized Gains on Equities: $1,413,000 (46%).
Realized Gains (Investments): $549,000 (18%).
Solar Tax Credit: $373,000 (12%).
Critical Insight:
~50% of Net Income ($2.46M) is tied to investments (dividends, unrealized/realized gains, tax credits).
3. Performance of Investments
A. Realized Gains/Losses (6M 2024):
Equity Sales: 646,000 gains vs. 83,000 losses.
Debt Sales: 0 gains vs.14,000 losses.
Net Realized Gains: $549,000 (1.5% of portfolio value).
B. Unrealized Losses:
Management’s Stance:
Losses deemed not "other-than-temporary" due to intent to hold until recovery.
Municipal bonds ($7.4M) are low-risk but sensitive to interest rates.
Valuation of Investments
Intrinsic Value Estimate:
Fair Value: $36.36M (as reported).
Upside: $10.7M unrealized gains in equities (potential liquidity if sold).
Downside Protection: $7.4M in municipal bonds (stable but low-yield).
Adjusted Book Value of operating business:
Total Assets: $60.78M (2024 TTM).
Investments + Cash: $41.6M (68% of assets).
Implied Business Value: 60.78M–36.36M = $24.42M (operations value).
Strengths & Opportunities
· Retained Earnings Growth: Increased from $32.4M (2014) to $56.8M (2024).
· Share Buybacks: Outstanding shares reduced by 2.7% since 2014 (2024 TTM diluted shares: 4.9M).
· Dividend Strength: Sustainable 5.8% yield with a payout ratio of 43.8%.
Intrinsic Value Estimate
Discounted Cash Flow (DCF)
Assumptions:
Keep reading with a 7-day free trial
Subscribe to Moods Investment Research to keep reading this post and get 7 days of free access to the full post archives.


