


Apple Inc. 2025 Outlook: Reinvesting in America, Defending Against Tariffs, Creating Shareholder Value
Apple’s Road to 2030 and Beyond: Reinvesting for Growth, Navigating Global Trade Risks, and Strengthening Competitive Advantage

Financial Analysis of Apple Inc.
As of April 8, 2025
Prepared by: Moods Investment Research Inc.
This report provides a comprehensive evaluation of Apple Inc.’s financial performance, investment value since its initial public offering (IPO), capital return strategy, retained earnings, intrinsic valuation using the Free Cash Flow to Firm (FCFF) method, and future growth outlook. All data reflects the latest available information as of April 8, 2025, offering actionable insights for investors.
Executive Summary
1. Investment Growth: A $22 investment at Apple’s 1980 IPO would be worth approximately $52,775 today with dividends reinvested, reflecting a total return of ~239,881%.
2. Capital Return: Apple has returned $958 billion to shareholders since 2012 via dividends and buybacks. Negative retained earnings in recent quarters signalling a shareholder-focused strategy, not financial distress.
3. Capital Expenditure (Growth vs Maintenance CAPEX): Historically Apple required little capital to sustain its day-to-day business operations. However, Apple's announcement on February 24, 2025, to invest $500 billion in the U.S. over the next four years is a significant move that could have wide-ranging impacts on the company, the U.S. economy, and its returns by 2029. Apple has to continuously invest and innovate to maintain its MOAT.
4. Challenges and Risks: Tariffs may slow growth, but supplier cost absorption and consumer pricing power mitigate risks. Trump’s new tariff package raises levies on Chinese goods to at least 54% while imposing a 26% rate on Indian goods. On Monday, Trump threatened to add to China tariffs if the country doesn’t remove the retaliatory duties they announced after U.S. tariff plans were revealed on April 2. The iPhone is Apple’s signature product and makes up about 50% of its revenue. The company’s heavy reliance on China for manufacturing has spooked investors concerned about its exposure to tariffs, leading to a 19% decline in its shares, its worst three-day performance in nearly 25 years.
5. Valuation: Intrinsic value per share is $247.09, suggesting undervaluation at the current price of $181.46. With a 4.9% annual share reduction, this could rise to $416.67 in 10 years.
6. Growth Outlook: Apple’s $500 billion investment has the potential to boost its returns by 2029-30 through revenue growth, cost savings, and sustained capital efficiency. Revenue could grow to $485-$515 billion in 4-5 years (5-7% CAGR), driven by AI enhancements and potential new products. EPS could rise due to cost savings from tariff avoidance and operational efficiencies, potentially improving margins by 1-2%. A sustained 35-40% ROIC on the new capital could generate $175-$200 billion in cumulative operating profit, supporting higher earnings and stock valuation. Total returns of 26-36% over 4-5years (6-8% annually), assuming modest stock price growth and dividends.
1. Investment Growth (Value Since IPO)

Stock Splits:
2-for-1 in 1987, 2000, and 2005.
7-for-1 in 2014.
4-for-1 in 2020.
Total split factor: 224 (1 IPO share equals 224 shares today).
Apple’s IPO on December 12, 1980, priced shares at $22. Adjusted for stock splits (2:1 in 1987, 2000, 2005; 7:1 in 2014; 4:1 in 2020), 1 share becomes $224 shares today. At the current price of $181.46 (April 7, 2025, Yahoo Finance), this equates to:
Without Dividends: 224 × $181.46 = $40,647.04.
With Dividends Reinvested: Historical data suggests a $22 investment grows to $52,775, a ~239,881% return, driven by price appreciation and dividend compounding.
Total Capital Return (Since 2012)

Since resuming dividends in 2012, Apple has returned $958 billion to shareholders to this day:
Dividends: $15.2 billion in 2024, with steady growth.
Buybacks: Reduced shares outstanding, enhancing EPS.
This reflects a mature a company prioritizing shareholder value over cash retention.
Capital Expenditure (CAPEX: Maintenance vs Growth)


Note: The Maintenance and Growth CapEx percentages are based on the assumption that Maintenance CapEx is 2.5% of PP&E. In a real-world scenario, you’d use depreciation data or company-specific guidance to split CapEx more accurately.
Observations:
PP&E as % of Sales: This fluctuates between 13.32% and 16.51%, indicating that Apple’s investment in PP&E relative to sales varies year to year, likely due to strategic investments in infrastructure and manufacturing capacity.
Sales Growth: Apple saw significant growth in 2022 (33.26%), likely due to strong iPhone sales or new product launches, but growth slowed in 2023 (7.79%) and turned negative in 2024 (-2.80%), possibly due to market saturation or economic conditions.
CapEx Split: The majority of CapEx is allocated to Growth (84.50%–91.10%), which aligns with Apple’s focus on innovation, new product development, and expanding its ecosystem (e.g., new facilities, R&D centers, or supply chain investments).
Negative Retained Earnings (In most recent Quarters)
Apple’s retained earnings have turned negative (accumulated deficit) in recent quarter
Apple’s accumulated deficit of $11,221 million as of December 28, 2024, is primarily due to its aggressive share repurchase program ($23,476 million in Q1 2025) and dividend payments ($3,819 million), which exceed the net income retained in the company.
Cause: Distributions (dividends + buybacks) exceed retained profits, despite annual net income and FCF >$100 billion.
So, how did the accumulated deficit come about?
The accumulated deficit came about through a combination of Apple’s financial strategies:
Share Repurchasing Program: Apple began its share repurchase program in 2012, and since then, it has consistently repurchased shares to reduce the number of shares outstanding, boost earnings per share, and return capital to shareholders. These repurchases are recorded as a reduction in retained earnings.
Dividend Payments: Apple has paid dividends since 2012, and these payments also reduce retained earnings. The company has increased its dividend over time, reflecting its commitment to returning capital to shareholders.
Profitability vs. Distributions: While Apple is highly profitable, its strategy of returning most of its free cash flow to shareholders through repurchases and dividends means that retained earnings are not accumulating as they would in a company that retains more earnings for reinvestment. This aggressive return of capital has outpaced the accumulation of retained earnings, leading to a negative balance.
The beginning balance of ($19,154) million as of September 28, 2024, indicates that prior to this quarter, Apple’s cumulative distributions (dividends, repurchases, and other adjustments) exceeded its cumulative net income.
Net Income Not Sufficient to Offset Distributions:
While Apple’s net income is substantial ($36,330 million in Q1 2025), the combined effect of repurchases ($23,476 million) and dividends ($3,819 million) totals $27,295 million, plus the $1,102 million adjustment for net share settlement. This means $28,397 million was deducted from retained earnings, which, despite the high net income, still contributes to a negative balance when starting from a deficit.
Resolving the EU Dispute: Apple’s Q4 2024 Tax Charge
In Q4 2024, Apple recorded a one-time net tax charge of $10.2 billion to resolve its long-standing dispute with the European Union over alleged illegal state aid via Ireland.
Tax Breakdown:
$15.8 billion payable to the Irish government as ordered by the European Commission
Offset by:
A $4.8 billion U.S. foreign tax credit
A $823 million decrease in unrecognized tax benefits
Provisioning and Financial Impact:
This payment did not come as a financial shock — Apple had previously allocated funds in escrow in anticipation of a potential ruling, following the original 2016 EU judgment. Thus, while it was formally recognized in the financials in Q4 2024, the cash impact was neutral to ongoing operations and had no effect on Free Cash Flow (FCF).
The charge is non-operational and serves to settle a major regulatory overhang, bringing finality to a multi-year legal battle that had loomed over Apple’s EU tax posture.
Not a Sign of Weakness: For a company like Apple, an accumulated deficit does not indicate financial trouble. Apple has $30,299 million in cash and equivalents, $22,476 million in marketable securities, and generates significant cash flow from operations ($29,935 million in Q1 2025). The deficit is a result of its capital return strategy, not operational losses.
Accounting Adjustments:
Adjustments like the net share settlement of equity awards (e.g., $1,102 million in Q1 2025) also reduce retained earnings, as shares withheld to cover taxes on equity awards are often accounted for as a reduction in retained earnings.
Implication: A deliberate strategy, not a red flag, given strong cash flows.
Invested Capital
Invested Capital grows from $40.25 billion in Year 2015 to $69.63 billion in Year 2017, fluctuates over the next few years (peaking at $94.48 billion in Year 2019), drops to a low of $33.96 billion in Year 2022, and then spikes dramatically to $222.28 billion in Year 2024.
Apple has recently announced that it will spend more than $500 billion in the U.S. over the next four years in facilities to expand in Michigan, Texas, California, Arizona, Nevada, Iowa, Oregon, North Carolina, and Washington . Its Plans include a new factory in Texas, doubling the U.S. Advanced Manufacturing Fund, a manufacturing academy, and accelerated investments in AI and silicon engineering.
The early growth in Invested Capital (Year 2015 to Year 2017) suggests Apple was investing heavily, possibly in new products, manufacturing, or infrastructure as part of that total $500 billion investment plan. The fluctuations between Years 2018 and 2023 (ranging from $33.96 billion to $94.48 billion) reflects capital management strategies like share repurchasing (which reduces equity capital) and paying down debt.
The sharp increase to $222.28 billion in Year 2014 is significant indicating a major investment, acquisition, and expansion already e.g., in new facilities, R&D for projects like the Apple Car or AR/VR products). Alternatively, it also reflects a change in capital structure, such as taking on more debt. The dramatic rise in Invested Capital in Year 2014, combined with a still-high ROIC (44.31%), suggests Apple is deploying a large amount of capital efficiently.
ROIC (Return on Invested Capital): ROIC starts at 23.76% in Year 2015, dips to 15.80% in Year 2017, then rises steadily to a peak of 45.17% in Year 2022, before slightly declining to 44.31% in Year 2024.
The initial decline from 23.76% to 15.80% in the first 3 years indicates a period of heavy investment (e.g., infrastructure, R&D, new product launches like the Apple Watch or AirPods), which temporarily reduced returns on capital.
The steady increase from Year 2017 (15.80%) to Year 2022 (45.17%) is impressive, showing that Apple significantly improved its ability to generate profits from its invested capital. This is due to improving higher margins (e.g., from iPhone sales, services growth like Apple Music or iCloud), better operational efficiency, and effective capital allocation i.e., share buybacks reducing equity capital.
The slight dip from 45.17% to 44.31% in the last two years is minor and still reflects a very high ROIC, indicating sustained efficiency. Apple’s ROIC growth from 15.80% to 44.31% over the 10-year period is a strong sign of operational excellence and capital efficiency. A ROIC above 40% in the later years is exceptional, suggesting Apple is generating significant value for every dollar of capital invested.
CAPEX in Infrastructure Building for future Growth
Apple's announcement on February 24, 2025, to invest $500 billion in the U.S. over the next four years is a significant move that could have wide-ranging impacts on the company, the U.S. economy, and its returns by 2029-30. By investing in domestic production of AI servers and silicon chips (e.g., through TSMC’s Arizona facility), Apple is reducing its reliance on overseas manufacturing, particularly in China. This aligns with broader U.S. policy goals to reshore critical technology production, especially amid tariff threats from the Trump administration. The tariff on Chinese goods for example for Apple’s iPhone 16 Pro that currently retails for $1,100, could go up according to TechInsights. Apple could limit the damage by importing phones from India where the tariff is about half as high.
During Trump’s first term, Apple secured tariff exemptions, and this $500 billion investment may be a strategic move to gain similar exemptions by demonstrating commitment to U.S. manufacturing. There’s no doubt high tariff by the U.S. against China may raise costs, slowing growth. However, Suppliers may absorb some of these costs; consumers may accept higher prices due to inflation and a weaker US Dollar.
Impact on Costs: By producing AI servers and some chips domestically, Apple can mitigate the financial hit from tariffs, which could range from 10% to 25% on imported goods. This reduces the risk of cost increases for its products, particularly iPhones, which remain its largest revenue driver.
Supply Chain Resilience: Shifting some production to the U.S. (and potentially increasing production in India, diversifies Apple’s supply chain, reducing dependence on China amid U.S.-China trade tensions. This could make Apple more resilient to geopolitical disruptions, such as trade wars or supply chain bottlenecks.
Boosting Apple’s AI and Innovation Capabilities: A significant portion of the investment is directed toward AI infrastructure, including the Houston facility for Apple Intelligence servers and data center expansions. Apple is also investing $75 billion in AI-driven hardware production, with job creation in tech hubs like Silicon Valley and Austin.
Impact on Product Development: Enhanced AI capabilities could improve Apple’s product ecosystem, particularly its iPhone, Mac, and services like Siri and Apple Intelligence. Better AI integration could lead to new features, improved user experiences, and potentially new product categories (e.g., advancements in AR/VR with the Apple Vision Pro).
Competitive Advantage: Apple has been perceived as lagging behind competitors like Microsoft and Meta in AI investment. This $500 billion commitment signals a shift, potentially allowing Apple to catch up or lead in AI-driven innovation, which is increasingly critical in the tech industry.
Scale of Investment Relative to Apple’s Operations: Apple’s annual revenue in 2023 was around $394 billion, and its free cash flow is approximately $100 billion per year. The $500 billion over four years (averaging $125 billion annually) includes not just new capital expenditures but also existing spending (e.g., U.S. employee salaries, Apple TV+ productions). Analysts have questioned how much of this is truly incremental spending, noting that Apple’s capital expenditures in 2024 were only 2.4% of its earnings, far lower than competitors like Microsoft or Meta.
Infrastructure Bottlenecks: Data center construction timelines have stretched to four years or more due to power availability constraints and labor shortages. Apple may face delays in building its new facilities, which could slow the rollout of AI infrastructure and impact returns.
Low-Growth Business Model: Apple’s revenue growth has been modest (4% year-over-year in its latest quarter), and it relies heavily on the iPhone, which has limited growth prospects outside of price increases. Without a new flagship hardware product to drive revenue, the investment may not significantly boost top-line growth.
Challenges and Risks:
Challenges in India.
Despite its success, Apple faces several hurdles in India:
Competition: India’s smartphone market is dominated by Android devices, with Apple holding only 6.5% of the market by volume in 2023. Local competitors like Xiaomi and Samsung offer lower-cost alternatives, posing a challenge to Apple’s premium pricing strategy.
Regulatory Pushback: Apple has faced regulatory challenges in India, particularly around its production targets. In 2023, Apple lobbied against India’s adoption of EU-style rules requiring universal USB-C charging ports for all smartphones by June 2025, arguing that applying the rule to existing iPhone models would hinder its production targets under India’s production-linked incentive (PLI) scheme. Apple requested an exemption for older models or an 18-month delay beyond 2024, warning that non-compliance could impact its ability to meet PLI goals.
Proposed Digital Competition Bill: India’s proposed Digital Competition Bill, modeled after the EU’s Digital Markets Act (DMA), aims to regulate large digital firms with global revenues exceeding $30 billion and at least 10 million local users. The bill seeks to prevent companies like Apple from exploiting user data, favoring their own services, or restricting app side loading. Apple, alongside Google and Amazon, has urged India to reconsider the bill, citing concerns over increased user costs, reduced investment, and a decreased range of services. The U.S.-India Business Council (USIBC) warned that the bill’s scope is broader than the EU’s DMA, potentially leading to significant repercussions for Apple.
Antitrust Investigation: In July 2024, India’s Competition Commission of India (CCI) found that Apple had abused its dominant position in the iOS app store market by forcing developers to use its proprietary in-app purchase system, which charges up to a 30% commission. The CCI report, which is under review, could lead to fines and directives to change business practices, similar to a $113 million fine imposed on Google in 2022 for similar practices.
Labor and Infrastructure: While India offers a young workforce, it lags behind China in labor skills and manufacturing maturity. Incidents like the 2020 labor riot at a Wistron factory in Bengaluru highlight the challenges of scaling production in India. Additionally, infrastructure bottlenecks, such as inadequate warehousing and logistical inefficiencies, pose hurdles, particularly in smaller cities.
Strategic Implications
Apple’s expansion in India is a long-term bet on a market with immense growth potential. By 2027, if India continues its current trajectory, it could surpass China as Apple’s largest iPhone market in terms of shipments, especially as China’s market share has declined from 24% in Q4 2023 to 14% in Q3 2024 due to competition from Huawei. However, Apple must navigate India’s regulatory landscape and competition to sustain its growth. The company’s focus on local manufacturing, retail expansion, and financing options positions it well to capture a larger share of India’s $88.99 billion smartphone market, projected to grow at an 8.1% annual rate through 2032.
Regulatory Challenges in the European Union
Overview of Regulatory Landscape
The EU has emerged as a significant regulatory battleground for Apple, with the bloc implementing stringent rules to curb the market power of Big Tech companies under the Digital Markets Act (DMA) and other antitrust measures. As of April 2025, Apple faces multiple challenges that could reshape its business model in the region, impact its global operations, and set precedents for other markets.
Digital Markets Act (DMA) Enforcement: The DMA, which took effect in March 2024, targets “gatekeeper” companies like Apple, requiring them to open their ecosystems to rivals and ensure interoperability. On March 19, 2025, the European Commission issued two decisions ordering Apple to comply with DMA interoperability obligations. The first order mandates Apple to grant rival makers of smartphones, headphones, and virtual reality headsets access to its iOS features, such as notifications on smartwatches, peer-to-peer Wi-Fi connections, and near-field communication (NFC) for easier device setup. The second order improves transparency in Apple’s process for handling interoperability requests from developers, ensuring faster and fairer access to iPhone and iPad features.
Antitrust Investigations: The EU has launched multiple antitrust cases against Apple. In June 2024, the European Commission accused Apple of breaching the DMA by imposing App Store rules that prevent app makers from directing users to cheaper alternatives outside the platform, such as Spotify subscriptions. This followed a $2 billion fine in March 2024 for unfairly favoring Apple Music over rivals like Spotify by restricting in-app payment options. The EU is also investigating Apple’s “core technology fee” of 50 euro cents per app download from third-party stores, which critics argue deters free apps from leaving Apple’s ecosystem.
Potential Fines: Non-compliance with DMA rules could lead to fines of up to 10% of Apple’s global annual sales, which were approximately $394 billion in 2023—potentially a $39.4 billion penalty. The EU’s competition chief, Teresa Ribera, emphasized that the bloc is “simply implementing the law” to provide regulatory certainty for Apple and developers.
Legal Challenges: Apple has pushed back against the DMA, filing a legal challenge in November 2023 to contest the inclusion of its App Store as a gatekeeper service. The company argued that the DMA’s requirements, such as allowing third-party app stores and sideloading, could compromise user privacy and security. Despite the appeal, Apple is required to comply with DMA rules while the case is ongoing.
Specific Regulatory Impacts
App Store Changes: The DMA has forced Apple to allow third-party app stores in the EU, breaking its “walled garden” model. This change, which Apple has long resisted, enables consumers to download apps from alternative sources, potentially reducing Apple’s control over app distribution and its 30% commission on in-app purchases. However, Apple’s introduction of the core technology fee has drawn criticism for undermining the DMA’s goal of fostering competition.
Interoperability Requirements: The March 2025 orders require Apple to open up iOS features to competitors, which could enhance the functionality of rival devices (e.g., smartwatches, headphones) when paired with iPhones. While this improves consumer choice and innovation, it challenges Apple’s ecosystem lock-in strategy, which relies on seamless integration between its devices and services.
Transatlantic Tensions: The EU’s actions have escalated tensions with the U.S., particularly under the Trump administration. Trump has threatened retaliatory tariffs on EU goods if the bloc continues to target U.S. tech companies, and Vice President JD Vance has criticized the EU’s AI regulations, such as the Artificial Intelligence Act, as excessive. This geopolitical friction could complicate Apple’s operations in both regions, especially if the U.S. imposes tariffs that affect Apple’s supply chain or cost structure.
Broader Implications
Impact on Business Model: The EU’s regulations threaten Apple’s revenue from the App Store and its services segment, which includes high-margin offerings like Apple Music and iCloud. Allowing third-party app stores and alternative payment systems could reduce Apple’s commission revenue, while interoperability requirements might weaken its ecosystem advantage, making it easier for consumers to switch to rival devices.
Precedent for Other Markets: The EU’s regulatory approach is influencing other regions, including India, which is adopting similar digital competition rules. If the EU succeeds in forcing Apple to open its ecosystem, it could set a global precedent, pressuring Apple to make similar changes in the U.S., where the Department of Justice filed a sweeping antitrust lawsuit against Apple in 2024 for monopolistic practices in the smartphone market.
Innovation vs. Regulation: Apple argues that the DMA’s requirements, such as sideloading and third-party app stores, could compromise user privacy and security by exposing iPhones to harmful apps. The EU counters that its measures ensure innovation while protecting user rights, but the tension between regulation and innovation remains a key challenge for Apple.
Strategic Response
Apple has taken a multi-pronged approach to navigate EU regulations:
Compliance with Resistance: While Apple has begun complying with the DMA—allowing third-party app stores and proposing changes to its App Store policies—it has also introduced fees like the core technology fee to offset potential revenue losses, drawing further scrutiny.
Legal Pushback: Apple’s legal challenge to the DMA reflects its strategy to delay or mitigate the impact of regulations, buying time to adapt its business model.
Public Relations: Apple has raised concerns about the DMA’s impact on user safety, framing its resistance as a defense of consumer interests rather than a protection of its market dominance.
Comparative Analysis and Broader Context
Apple’s expansion in India and regulatory challenges in the EU highlight the dual nature of its global strategy: pursuing growth in emerging markets while navigating regulatory headwinds in developed ones. In India, Apple is capitalizing on economic and demographic trends to drive sales and manufacturing, but it must contend with local competition and regulatory pressures that mirror the EU’s approach. In the EU, Apple faces a more immediate threat to its business model, with the DMA and antitrust actions challenging its ecosystem control and revenue streams.
Growth vs. Compliance: India offers Apple a growth opportunity with relatively manageable regulatory hurdles, though the proposed Digital Competition Bill and antitrust investigation signal increasing scrutiny. In contrast, the EU’s regulations pose a direct threat to Apple’s profitability and market dominance, with potential fines and forced changes to its ecosystem.
Geopolitical Dynamics: Both regions are influenced by broader geopolitical trends. In India, Apple benefits from U.S.-India alignment on reducing reliance on China, but it must navigate local policies and competition. In the EU, Apple is caught in transatlantic tensions, with the U.S. government potentially retaliating against EU regulations through tariffs, which could raise costs for Apple’s global operations.
Long-Term Implications: Success in India could offset some of the revenue pressures Apple faces in the EU, especially if India becomes a larger iPhone market than China by 2027. However, the EU’s regulatory precedent could inspire similar actions globally, forcing Apple to rethink its closed ecosystem model on a broader scale.
Valuation: Intrinsic Value Calculation (FCFF)
Using the FCFF method with an 8% discount rate (vs. WACC of 8.6%–10.69%, due to expected lower short-term rates): This is a slight increase due to a higher equity risk premium, but the overall WACC would still decrease due to a lower cost of debt and the risk-free rate’s impact.
An 8% discount rate is a conservative estimate that reflects a lower cost of capital in a low-interest-rate environment. It’s below the calculated WACC of 10.64%, which aligns with the expectation of declining rates.
Historically, discount rates for stable, high-quality companies like Apple can range from 8% to 12%, depending on market conditions. An 8% rate assumes a more favorable cost of capital environment, which is reasonable given the user’s expectation of lower interest rates.
2024 FCFF: $108.807 billion.
Growth Rate: 5% (conservative vs. 8.45% historical CAGR).
Total Debt: $96.79 billion.
Shares: 15.02 billion.
Calculation:
Year 1 FCFF = $114.2475 billion.
Terminal Value = $114.2475 / (0.08 - 0.05) = $3,808.25 billion.
Equity Value = $3,808.25 - $96.79 = $3,711.46 billion.
Intrinsic Value/Share = $3,711.46 / 15.02 ≈ $247.11.
Current Price: $181.46 → Undervalued by ~36%.
5. Future Projected Value with Buyback Expectations (Excl. Div.)
Apple’s shares have historically reduced at 4.9% annually:
2025 Shares: 15.02 billion.
2035 Shares: 15.02 × (0.951)^10 ≈ 8.91 billion.
Future 2035 Value/Share: $3,711.46 / 8.91 ≈ $416.67
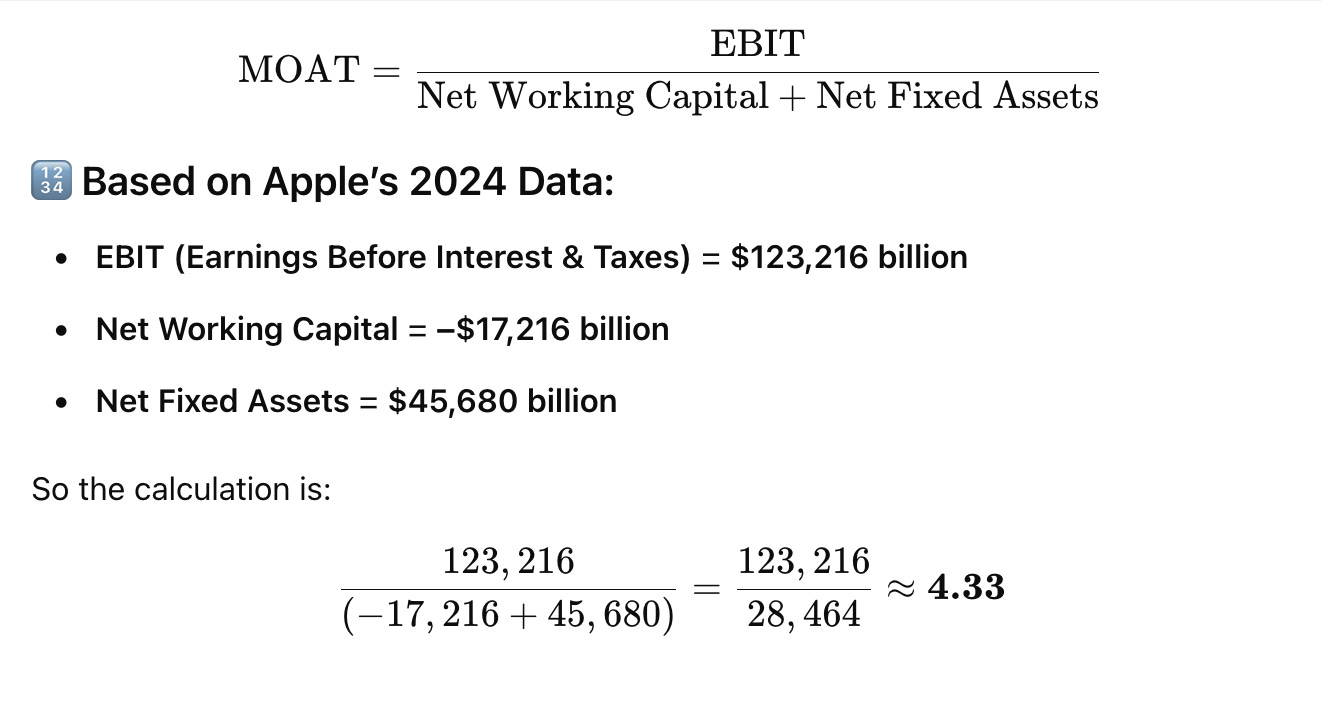
Interpretation of 2024 MOAT ≈ 4.33:
Apple is generating $4.33 in operating income for every $1 invested in net working capital and fixed assets. That’s a very efficient use of capital.
Apple’s 2024 MOAT shows it has a strong competitive edge, able to produce high profits without needing to heavily invest in physical assets or working capital.
It reflects an asset-light, high-margin model, typical of mature tech giants.
Other Key Valuation Metrics
i. Earnings Yield
Earnings Yield starts at 8.09% in Year 2015, declines steadily to a low of 2.95% in Year 2021 due to the Covid-19 pandemic, and then recovers slightly to 3.68% by Year 2024. The decline from 8.09% to 2.95% over the first 7 years suggests that Apple’s stock price likely grew faster than its earnings per share during this period, reducing the yield. This indicates a period of high market optimism, driving up the stock price and lowering the yield.
The slight recovery from Year 2021 (2.95%) to Year 2024 (3.68%) reflects a stabilization in stock price growth and an increase in earnings per share, making the stock relatively more attractive again. On the contrary, the earnings yield dropping to 2.95% in Year 2020-21 had made Apple less attractive to value investors at that point, as it indicates lower earnings relative to the stock price. The recovery to 3.68% is modest but still below the earlier years, suggesting Apple’s stock may have been trading at a premium in later years.
ii. Free Cash Flow Yield
Free Cash Flow Yield follows a similar pattern to Earnings Yield, starting at 10.57% in Year 2015, dropping to 2.95% in Year 2021, and recovering slightly to 3.11% by Year 2024.
The decline from 10.57% to 2.95% mirrors the trend in Earnings Yield, reinforcing the idea that Apple’s stock price likely outpaced its free cash flow growth during this period.
The drop to 2.95% in Year 2020-21 is a low point, indicating that Apple was generating less free cash flow per dollar of stock price, due to increased capital expenditures, share repurchases, and a higher stock valuation.
The recovery to 3.11% by Year 2024 is modest, suggesting some improvement in free cash flow generation relative to the stock price, but it remains well below the earlier years. The decline over the first 7 years raises concerns about Apple’s cash flow efficiency during that period, but the slight uptick in recent years suggests some stabilization.
Key Takeaways:
Strengths: Apple demonstrates strong capital efficiency (high ROIC) and has maintained profitability even as its stock price grew (reflected in the recovery of Earnings and Free Cash Flow Yields in recent years). The company’s ability to generate a ROIC above 40% while scaling Invested Capital in Year 2024 is impressive.
Concerns: The decline in Earnings and Free Cash Flow Yields over the first 7 years suggests Apple’s stock may have been overvalued at times, potentially driven by market hype. The sharp increase in Invested Capital in Year 2024, while paired with a high ROIC, introduces some risk if those investments don’t yield expected returns. For example, in 2025, it announced that it would spend more than $500 billion in the U.S. to expand and build facilities over the next four years in states like Michigan, Texas, California, Arizona, Nevada, Iowa, Oregon, North Carolina, and Washington. Its Plans to open up new factories and advanced Manufacturing and make investments in AI and silicon engineering.
Investment Perspective: Apple appears to be a strong performer with excellent capital efficiency, but its lower yields in recent years suggest it may not be a “value” stock. Investors should weigh the high ROIC and growth potential against the possibility of overvaluation and the risks associated with the large capital deployment in recent years.
6. Growth Outlook
1. Revenue Growth from AI and New Products
AI-Driven Features: The investment in AI infrastructure (e.g., $75 billion for AI hardware and data centers) could enhance Apple’s product ecosystem, leading to higher sales. For example, improved Apple Intelligence features might drive iPhone upgrades or increase adoption of services like iCloud and Apple Music, which already surpassed the combined revenue of Mac, iPad, and wearables in 2024.
New Product Categories: If Apple successfully leverages its AI investments to innovate in areas like AR/VR (e.g., Apple Vision Pro) or other hardware (e.g., a potential Apple Car), it could open new revenue streams. Historically, Apple’s major product launches (e.g., iPhone, Apple Watch) have significantly boosted revenue.
Potential Impact: If AI enhancements and new products drive a 5-7% annual revenue growth rate (above the current 4%), Apple’s revenue could grow from $394 billion in 2023 to approximately $485-$515 billion by 2029. This would directly improve earnings and free cash flow, boosting returns for investors.
2. Margin Improvement from Cost Savings
Tariff Avoidance: By producing more in the U.S., Apple can avoid tariffs on Chinese imports, which could save billions annually. For context, Apple imports $60-$100 billion worth of goods from China each year. A 10% tariff on $80 billion of imports would cost $8 billion annually, so domestic production could significantly reduce this expense.
Operational Efficiency: The manufacturing academy in Detroit and investments in skills development could improve Apple’s operational efficiency, reducing production costs over time.
Potential Impact: If Apple saves $5-$10 billion annually on tariffs and operational costs, its profit margins could improve by 1-2 percentage points. With a current net margin of around 25%, this could increase earnings per share (EPS), supporting a higher stock price and better returns.
3. ROIC and Capital Efficiency
Based on the last 10-year’s data, Apple’s ROIC has been exceptional, rising from 23.76% in Year 2015 to 44.31% in Year 2024. The $500 billion investment includes a sharp increase in invested capital in Year 2024 to $222.28 billion, which aligns with the timing of this announcement.
Sustained High ROIC: Apple’s ability to maintain a ROIC above 40% while deploying $500 billion suggests it can generate significant value from this investment. For example, if Apple invests $125 billion annually and achieves a 40% ROIC, it could generate $50 billion in annual operating profit from the new capital by 2029-30.
Share Buybacks: Apple has historically used its free cash flow for share repurchasing, which reduces invested capital and boosts ROIC. If Apple continues this strategy, it could further enhance returns for shareholders by increasing EPS.
Potential Impact: A sustained or slightly lower ROIC (e.g., 35-40%) on the $500 billion investment could add $175-$200 billion in cumulative operating profit over four to five years, significantly boosting Apple’s market valuation and stock returns.
4. Stock Valuation and Investor Sentiment
Market Confidence: If Apple delivers on its promises, investor confidence could drive its stock price higher.
Valuation Metrics: Apple is currently trading at a premium price-to-earnings (P/E) ratio of close to 30, which some analysts argue makes it less attractive given its low growth. However, if revenue and EPS grow as projected (e.g., 5-7% annually), and Apple maintains or improves its margins, its P/E could become more justified, potentially leading to stock price appreciation.
Potential Impact: If Apple’s stock price grows at a compound annual growth rate (CAGR) of 5-7% (in line with revenue growth), and its P/E contracts slightly to let’s say 25, the stock could deliver total returns (including dividends) of 6-8% annually, translating to a cumulative return of 26-36% by 2029-30.
Critical Considerations and Alternative Perspectives
While the above analysis suggests positive impacts, there are reasons to be cautious:
Historical Precedents: Apple has made similar large-scale investment announcements in the past—$350 billion in 2018 and $430 billion in 2021—often with the same 20,000-job target. However, there’s little public accounting of how much of those pledges were incremental versus existing spending. This raises questions about how much of the $500 billion is truly new investment.
Modest Job Creation: Apple employed 164,000 people globally as of September 2024. Adding 20,000 jobs over four years (5,000 per year) represents only a 3% annual increase, which is modest for a $500 billion commitment. This suggests the investment may not be as transformative as the headline figure implies.
AI Investment Lag: Apple has been criticized for lagging in AI compared to competitors like Microsoft and Meta, which spend more on R&D (12-27% of revenue versus Apple’s 8%). If Apple’s AI initiatives don’t deliver competitive products, the investment may not yield the expected returns.
Economic and Political Risks: Infrastructure bottlenecks, rising Treasury yields (which could increase borrowing costs), and potential policy shifts under the Trump administration (e.g., changes to the Chips Act) could hinder Apple’s ability to execute its plans.
Conclusion
Apple’s $22 IPO investment has grown to $52,775, driven by a $958 billion capital return since 2012. Despite negative retained earnings, its intrinsic value ($247.09) exceeds its current price ($181.46), with potential to reach $416.67 by 2035 via buybacks. The lower discount rate and share reduction both significantly increase Apple’s high intrinsic value per share, almost doubling, reflects the impact of a more favorable cost of capital environment and the value-accretive nature of Apple’s buyback program.
Apple might face slower growth due to tariffs, especially U.S.-China tensions, but suppliers could absorb some of these costs, and consumers might handle higher prices given high inflation as a result of a weaker Dollar.
Apple’s market expansion in India is a strategic success, driven by strong sales growth, local manufacturing, and retail investments. By 2026, India is poised to become Apple’s third-largest market, providing a critical growth engine as the company diversifies away from China.
However, regulatory challenges, such as the Digital Competition Bill and antitrust scrutiny, could complicate Apple’s plans, particularly if they mirror the EU’s stringent approach. In the EU, Apple faces significant regulatory headwinds under the DMA and ongoing antitrust investigations. The bloc’s push to open Apple’s ecosystem threatens its business model, with potential fines and forced changes that could set a global precedent. While Apple is complying with some requirements, its legal challenges and new fees reflect a strategy of resistance, balancing compliance with efforts to protect its profitability.
Together, these dynamics underscore Apple’s challenge in 2025: balancing growth in emerging markets like India with the regulatory pressures of developed markets like the EU, all while navigating geopolitical tensions that could shape its global operations.
Apple’s $500 billion investment has the potential to boost its returns by 2029-30 through revenue growth, cost savings, and sustained capital efficiency.
Revenue could grow to $485-$515 billion by 2029-30 (5-7% CAGR), driven by AI enhancements and potential new products. EPS could rise due to cost savings from tariff avoidance and operational efficiencies, potentially improving margins by 1-2%.
A sustained 35-40% ROIC on the new capital could generate $175-$200 billion in cumulative operating profit, supporting higher earnings and stock valuation. Expected total returns of 26-36% over four to five years (6-8% annually) is possible, assuming modest stock price growth and dividends.
However, these returns are not guaranteed. Apple’s success will depend on its ability to innovate in AI, manage infrastructure challenges, and navigate geopolitical risks. While the investment strengthens Apple’s strategic position in the U.S., its impact on returns may be modest unless it leads to significant revenue growth or a breakthrough product. Investors should monitor Apple’s progress in AI and new hardware offerings, as these will be key drivers of future returns.
Disclaimer
This report is for informational purposes only and does not constitute investment advice, nor is it an offer to buy or sell any securities. Moods Investment Research and its Directors hold a position in Apple Inc. Investors are strongly encouraged to conduct their own analysis and due diligence before making any investment decisions. The information presented is based on data available as of April 8, 2025, and future performance may vary due to market conditions, economic factors, or other unforeseen events.